Optimize Memory Transfers
Using CUDA profiler to figure why our renderer is slow
In the previous post we did a performance analysis of our cpu code for the 10 first frames, and we got the following results:
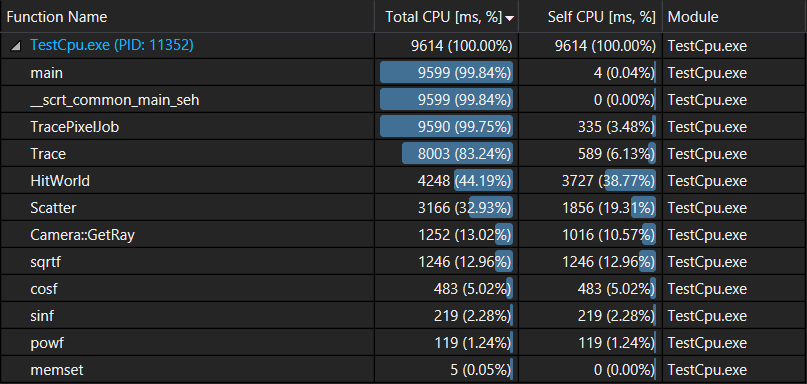
We realized that 44% of the rendering time, or 4.2s, is spent in HitWorld(). Our CUDA implementation didn’t show any performance improvement, so let’s use Nvidia CUDA profiler to figure out why.
One of the tools provided by CUDA is a handy command line profiler. We just need to pass our executable to the profiler as follows:
nvprof.exe ./Cpp/Windows/x64/Release/TestCpu.exe
And it outputs among other things the following summary:
            Type  Time(%)      Time     Calls       Avg       Min       Max  Name
 GPU activities:   49.39%  2.25862s       110  20.533ms  18.892ms  25.130ms  [CUDA memcpy DtoH]
                   42.17%  1.92833s       111  17.372ms  1.0560us  18.822ms  [CUDA memcpy HtoD]
                    8.44%  386.12ms       110  3.5102ms  1.6123ms  11.033ms  HitWorldKernel(DeviceData, float, float)
      API calls:   96.29%  4.61734s       221  20.893ms  131.28us  31.136ms  cudaMemcpy
                    2.57%  123.34ms         3  41.113ms  4.2510ms  114.19ms  cudaMalloc
                    1.02%  48.903ms         1  48.903ms  48.903ms  48.903ms  cuDevicePrimaryCtxRelease
                    0.06%  2.9779ms       110  27.071us  20.787us  70.382us  cudaLaunchKernel
                    0.03%  1.4047ms         3  468.24us  404.42us  565.61us  cudaFree
                    0.02%  1.0182ms        47  21.663us     364ns  510.54us  cuDeviceGetAttribute
                    0.01%  353.37us         1  353.37us  353.37us  353.37us  cuModuleUnload
                    0.00%  42.302us         1  42.302us  42.302us  42.302us  cuDeviceGetName
                    0.00%  27.715us         1  27.715us  27.715us  27.715us  cuDeviceGetPCIBusId
                    0.00%  10.940us         1  10.940us  10.940us  10.940us  cuDeviceTotalMem
                    0.00%  2.5530us         3     851ns     364ns  1.8240us  cuDeviceGetCount
                    0.00%  1.0940us         2     547ns     364ns     730ns  cuDeviceGet
From the report we can see that intersection kernel only takes 386ms which is great compared to the 4.2s taken on cpu. We can also see that most of the time is spent transferring memory between the host (cpu) and the device (gpu): cudaMemcpy takes 4.6s or 96% of the time. Let’s try to understand why this is happening.
How much memory are we copying per frame ?
numRays = imageWidth x imageHeight x samplesPerPixel
In our particular test: numRays = 1280 x 720 x 4 = 3,686,400 rays
size of rays array = numRays x sizeof(cRay) = 3,686,400 x 28 = 103,219,200B
size of hits array = numRay x sizeof(cHit) = 3,686,400 x 32 = 117,964,800
For each depth iteration (kMaxDepth+1 iterations) we need to copy all rays to the device and all hits from the device so the total memory copied each frame is about 2.2GB. And for 10 frames it’s 22GB. This seems a lot, but it depends how fast can we copy the memory to and from the device.
How fast can we copy memory between host and device ?
Nvidia’s developer’s blog has an interesting post on How to Optimize Data transfers in CUDA. In particular they share a bandwidth test tool that we are going to use to measure the bandwidth between host and device memory. Running the tool I got:
Device: GeForce GTX 1050
Transfer size (MB): 16

Pageable transfers
  Host to Device bandwidth (GB/s): 5.727420
  Device to Host bandwidth (GB/s): 5.882944

Pinned transfers
  Host to Device bandwidth (GB/s): 10.915390
  Device to Host bandwidth (GB/s): 11.330567
We can see that for regular “pageable” host memory, we can at most copy 6GB/s. When rendering 10 frames we need to copy 22GB of memory which will take at least 3.6s to complete. The profiler reports we spent 4.6s doing the copy and the extra time can be caused by the overhead of doing 110 smaller copies. Looks like memory transfer between host and device memories is really slow and can cause real performance issues like in our case.
Optimize memory copy
CUDA Programming Guide has some suggestions on how we can optimize data transfers between host and device:
- move more code from host to device
- batching many small transfers into a single large transfer, to reduce memory overhead. In our case this is not possible as we rely on the cpu to do some computations before handling the next batch of data
- using pinned host memory
- and we also just reduce how much data we need to copy
Move more code from host to device
As we noted in the previous post, another approach to optimize our renderer is to move the whole rendering logic to the gpu. In this case the only data we need to transfer is the computed colors, and depending on how many frames we compute on gpu at once we may only need to copy once at the end of the rendering. We’ll leave this to later in this post series.
Use a single large transfer
To reduce memory copy overhead, instead of copying a lot of small batches of data, we could combine them into a single copy. Only way we can do it in the lightweight approach is to compute more samples per pixels and use less frames, e.g. 8 samples x 50 frames instead of 4 samples x 100 frames. Doing so didn’t improve the performance of my renderer, as I guess +1GB per transfer was already large enough such that the copy overhead becomes negligible. Also the more samples we compute per frame the more data we need to copy.
Using Pinned memory
Looking at the bandwidth test results above, we can see that pinned host memory is nearly twice as fast than regular host memory.
The change is really simple: instead of allocating host memory using malloc() or new() we are going to use cudaMallocHost(). Pinned memory is limited though, and allocating too much of it may affect the performance of the OS.
With This change, renderer’s performance increased to 11.1M rays/s. nvprof does show that for 10 frames we are now spending 2.4s doing the copy instead of 4.6s:
            Type  Time(%)      Time     Calls       Avg       Min       Max  Name
 GPU activities:   44.93%  1.07889s       110  9.8081ms  9.2979ms  10.973ms  [CUDA memcpy DtoH]
                   38.99%  936.39ms       111  8.4360ms  1.0880us  9.3770ms  [CUDA memcpy HtoD]
                   16.08%  386.22ms       110  3.5111ms  1.6120ms  11.004ms  HitWorldKernel(DeviceData, float, float)
      API calls:   90.56%  2.42955s       221  10.993ms  220.99us  20.592ms  cudaMemcpy
                    6.10%  163.71ms         2  81.854ms  27.469ms  136.24ms  cudaMallocHost
                    1.88%  50.456ms         1  50.456ms  50.456ms  50.456ms  cuDevicePrimaryCtxRelease
                    0.86%  23.114ms         2  11.557ms  10.809ms  12.306ms  cudaFreeHost
                    0.38%  10.177ms         3  3.3923ms  587.49us  5.0215ms  cudaMalloc
                    0.12%  3.2470ms       110  29.518us  20.057us  63.818us  cudaLaunchKernel
                    0.06%  1.4758ms         3  491.94us  363.58us  582.75us  cudaFree
                    0.03%  868.29us        52  16.697us     364ns  422.66us  cuDeviceGetAttribute
                    0.01%  265.48us         1  265.48us  265.48us  265.48us  cuModuleUnload
                    0.00%  37.561us         1  37.561us  37.561us  37.561us  cuDeviceGetName
                    0.00%  23.704us         1  23.704us  23.704us  23.704us  cuDeviceTotalMem
                    0.00%  8.7520us         1  8.7520us  8.7520us  8.7520us  cuDeviceGetPCIBusId
                    0.00%  2.5530us         3     851ns     365ns  1.8230us  cuDeviceGetCount
                    0.00%  1.0940us         1  1.0940us  1.0940us  1.0940us  cuDeviceGet
Reducing the size of cRay and cHit
Here are the 2 structures transferred between host and device memory:
struct cHit
{
    float3 pos;
    float3 normal;
    float t;
    int id = -1;
};

struct cRay
{
    float3 orig;
    float3 dir;
    bool done = false;
};
Looking closely at cHit we notice that we can actually compute pos from t and normal from pos and id by delegating the computation to the intersected Sphere, this will save us 24B. For cRay we can remove done and replace it by setting direction to (0, 0, 0) which saves 4B. So in total we can reduce the amount of memory needed per sample from 60B to 32B, this should in turn half the duration of memory copy.
After making the change, performance went up to 12.3M rays/s and profiling 10 frames gives the following numbers:
            Type  Time(%)      Time     Calls       Avg       Min       Max  Name
 GPU activities:   61.43%  812.53ms       111  7.3201ms  1.1200us  8.1027ms  [CUDA memcpy HtoD]
                   20.80%  275.07ms       110  2.5006ms  2.3097ms  3.2744ms  [CUDA memcpy DtoH]
                   17.77%  235.01ms       110  2.1365ms  1.1687ms  5.1673ms  HitWorldKernel(DeviceData, float, float)
      API calls:   86.45%  1.35146s       221  6.1152ms  115.24us  8.9046ms  cudaMemcpy
                    9.16%  143.17ms         2  71.587ms  9.2339ms  133.94ms  cudaMallocHost
                    2.86%  44.718ms         1  44.718ms  44.718ms  44.718ms  cuDevicePrimaryCtxRelease
                    0.83%  12.913ms         2  6.4565ms  3.2974ms  9.6157ms  cudaFreeHost
                    0.37%  5.7345ms         3  1.9115ms  365.40us  3.7667ms  cudaMalloc
                    0.20%  3.1242ms       110  28.401us  18.963us  79.864us  cudaLaunchKernel
                    0.06%  1.0131ms         3  337.69us  232.66us  449.64us  cudaFree
                    0.06%  880.32us        45  19.562us     364ns  440.16us  cuDeviceGetAttribute
                    0.02%  281.89us         1  281.89us  281.89us  281.89us  cuModuleUnload
                    0.00%  38.656us         1  38.656us  38.656us  38.656us  cuDeviceGetName
                    0.00%  10.940us         1  10.940us  10.940us  10.940us  cuDeviceTotalMem
                    0.00%  8.3880us         1  8.3880us  8.3880us  8.3880us  cuDeviceGetPCIBusId
                    0.00%  2.5530us         2  1.2760us     365ns  2.1880us  cuDeviceGetCount
                    0.00%  1.4580us         2     729ns     364ns  1.0940us  cuDeviceGet
As expected memory transfer went down from 2.4s to 1.3s and we even reduced kernel execution time from 386ms to 235ms.
Can we reduce total number of rays we need to copy ?
In the previous post we made the decision to copy all rays to the device even if they are done and just skip them if they are done. But if a large proportion of rays is done, then we wasting time copying them to the device. In the next blog post we’ll figure out exactly how much rays are done (it’s +75%) and we’ll explore ways to improve kernel performance using this information.
Conclusion
Memory transfer between host and device memory is really slow, and we need to take that into account when designing kernel code, as it may make more sense to do a bit more computation on the gpu just to avoid copying the data. Knowing the memory bandwidth between host and device memory we can now easily estimate a lower bound on memory transfers for a particular kernel implementation.