Compact Non Active Rays
Alternative handling of done rays
In previous posts we made the decision to copy all rays to the device even if they are done, But if a large proportion of rays is done, then we are wasting time copying them to the device.
I instrumented the code to count how many rays are still active after each depth iteration, and here are the results for one of the rendered frame:
depth 0: 3686400/3686400 (100%)
depth 1: 3133257/3686400 (85%)
depth 2: 910847/3686400 (25%)
depth 3: 466469/3686400 (13%)
depth 4: 154520/3686400 (5%)
depth 5: 87086/3686400 (2%)
depth 6: 42822/3686400 (1%)
depth 7: 28084/3686400 (.8%)
depth 8: 16548/3686400 (.5%)
depth 9: 11901/3686400 (.3%)
depth 10: 7681/3686400 (.2%)
If we count the total number of active rays across all depth iterations we only have ~8.5M active rays from a total of 36.8M rays. So basically only 23% of the data copied actually matters. Memory transfer is expensive so we should only copy the active rays.
Only copy active rays
An alternative to copying all rays to gpu is to remove, or skip, those rays and only handle active rays. An easy way to do this in TraceIterative() is to keep track of a read and write index that both start at 0 and only increment the write index when we process an active ray. We use the write index to write the next active ray. Here is a link to the complete change.
With this change, the renderer’s performance went up to 15.8M rays/s. Nvprof output is as follows:
            Type  Time(%)      Time     Calls       Avg       Min       Max  Name
 GPU activities:   46.38%  168.54ms       111  1.5184ms  1.3760us  7.9660ms  [CUDA memcpy HtoD]
                   37.61%  136.66ms       110  1.2424ms  190.21us  5.2155ms  HitWorldKernel(DeviceData, int, float, float)
                   16.01%  58.181ms       110  528.92us  4.8000us  3.2030ms  [CUDA memcpy DtoH]
      API calls:   65.26%  385.09ms       221  1.7425ms  48.866us  8.4991ms  cudaMemcpy
                   23.55%  138.96ms         2  69.482ms  7.2482ms  131.71ms  cudaMallocHost
                    7.09%  41.856ms         1  41.856ms  41.856ms  41.856ms  cuDevicePrimaryCtxRelease
                    2.31%  13.629ms         2  6.8145ms  3.2744ms  10.355ms  cudaFreeHost
                    0.99%  5.8636ms         3  1.9545ms  454.38us  3.8287ms  cudaMalloc
                    0.38%  2.2522ms       110  20.474us  8.0230us  44.125us  cudaLaunchKernel
                    0.20%  1.1520ms         3  384.00us  293.93us  551.02us  cudaFree
                    0.16%  934.29us        50  18.685us     364ns  479.91us  cuDeviceGetAttribute
                    0.05%  290.64us         1  290.64us  290.64us  290.64us  cuModuleUnload
                    0.01%  48.866us         1  48.866us  48.866us  48.866us  cuDeviceGetName
                    0.00%  12.398us         1  12.398us  12.398us  12.398us  cuDeviceTotalMem
                    0.00%  8.7520us         1  8.7520us  8.7520us  8.7520us  cuDeviceGetPCIBusId
                    0.00%  2.5510us         3     850ns     364ns  1.8230us  cuDeviceGetCount
                    0.00%  1.0940us         1  1.0940us  1.0940us  1.0940us  cuDeviceGet
As we can see memory transfer went down from 1.3s to 385ms and hitWorld kernel from 235ms to 137ms. This is really good compared to the original numbers we had: 4.6s for memory transfer and 386ms for the kernel.
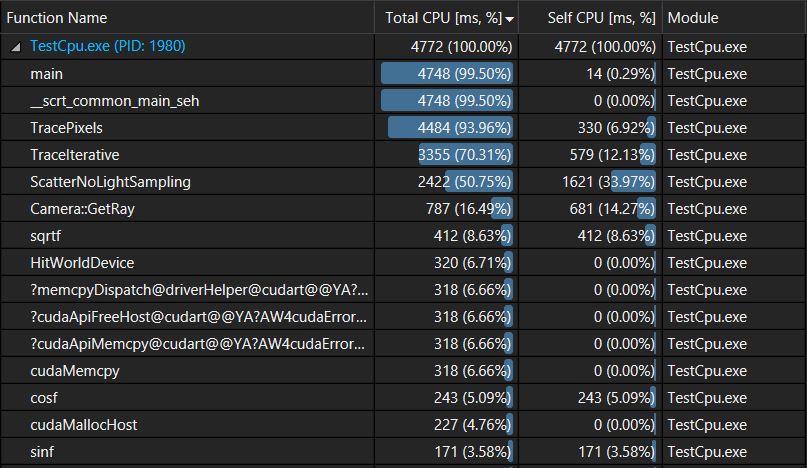
Let’s profile the cpu side of our code to see where we are spending the rendering time now:
Looks like we are on the right track: HitWorldDevice(), which includes memory transfer to and from the gpu + the kernel run, only takes 6.71% of the total execution time.
It’s important to note that the benefits we saw from our change depend on the scene and camera position. I’ts possible to come up with a particular scene where most of the rays bounce back for all 10 depth iterations and remain active all that time. But even for those “worst” cases, only copying the active rays shouldn’t make the performance worse.
