Improving Kernel Perf By 20x
I’ve been working on a highmap voxel renderer that generates the following renders:
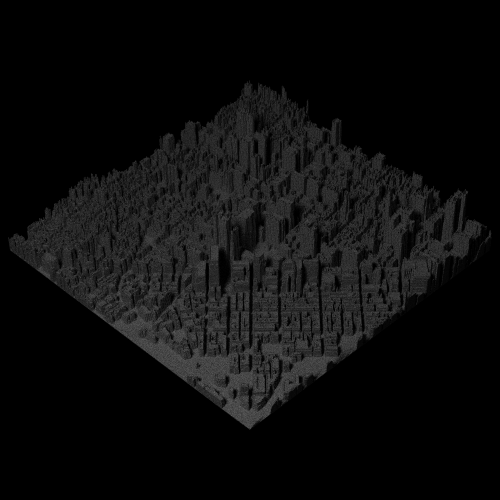
The project is looking good but the performance of the renderer is too low, it can render 2M rays/s and took 35s to render the above image.
most of the work is done in the GPU, through tow separate kernels:
- hit_scene: computes all ray/scene intersections, and
- simple_color: computes scattered ray, and color of terminal rays
By intuition, I suspected hit_scene would be the bottleneck, especially that for each ray it accesses global memory up to 512 times with no effort done to make those reads coallescent (basically having multiple threads share the memory read, thus boosting performance).
Before I started working on improving hit_scene, I decided to write a simple benchmark tool to measure both kernel performance independently, with the idea that it would make debugging performance issues and playing around with the code much more easier than working in the full renderer.
To do that I modified my renderer to store in files the input of both kernels:
void renderer::start_kernel(const work_unit* wu) {
	int threadsPerBlock = 128;
	int blocksPerGrid = (wu->length() + threadsPerBlock - 1) / threadsPerBlock;
#ifdef DBG_FILE
	output_file->write((char*)wu->h_rays, wu->length() * sizeof(ray));
#endif
	hit_scene <<<blocksPerGrid, threadsPerBlock, 0, wu->stream >>>(wu->d_rays, wu->length(), d_heightmap, model->size, 0.1f, FLT_MAX, wu->d_hits);
#ifdef DBG_FILE
	err(cudaMemcpy(wu->h_hits, wu->d_hits, wu->length() * sizeof(cu_hit), cudaMemcpyDeviceToHost), "copy hits from device to host");
	output_file->write((char*)wu->h_hits, wu->length() * sizeof(cu_hit));
#endif
	simple_color <<<blocksPerGrid, threadsPerBlock, 0, wu->stream >>>(wu->d_rays, wu->length(), wu->d_hits, wu->d_clrs, num_runs++, model_albedo, scene_sun, max_depth);
}
I then wrote a simple benchmark tool, that reads the files from disk, copies the data to global memory and runs both kernels, measuring the performance of each kernel independently.
To my surprise the benchmark numbers were as follows:
voxel size (512, 125, 512)
num_rays per iteration 250.0 thousand
num iterations 285 in 36 seconds
hit_scene took 11 seconds
  6.5 million rays/s
simple_color took 23 seconds
  3.1 million rays/s
Turns out hit_scene is twice as slow as hit_scene. Well hit_scene is not awesome either, but it’s clearly not the bottleneck for now. I looked at the code and tried to make sense what could be slowing down the kernel, then simplified the code as much as possible and ended with the following implementation:
__global__ void simple_color(const ray* rays, const uint num_rays, const cu_hit* hits, clr_rec* clrs, const uint seed, const float3 albedo, const sun s) {

	const int ray_idx = blockDim.x * blockIdx.x + threadIdx.x;
	if (ray_idx >= num_rays) return;

	const ray& r = rays[ray_idx];
	const cu_hit hit(hits[ray_idx]);
	clr_rec& crec = clrs[ray_idx];

	if (hit.hit_face == NO_HIT) {
		// no intersection with spheres, return sky color
		if (s.pdf_value(r.origin, r.direction) > 0) {
			crec.color = s.clr;
			crec.done = true;
		}
		else {
			crec.color = make_float3(0);
			crec.done = true;
		}
		return;
	}

	const float3 hit_n = make_float3(
		-1 * (hit.hit_face == X)*signum(r.direction.x),
		-1 * (hit.hit_face == Y)*signum(r.direction.y),
		-1 * (hit.hit_face == Z)*signum(r.direction.z)
	);

	pdf* scatter_pdf = new cosine_pdf(hit_n);

	const float3 hit_p(r.point_at_parameter(hit.hit_t));
	sun_pdf plight(&s, hit_p);
	mixture_pdf p(&plight, scatter_pdf);

	curandStatePhilox4_32_10_t lseed;
	curand_init(0, seed*blockDim.x + threadIdx.x, 0, &lseed);
	const float3 scattered(p.generate(&lseed));
	const float pdf_val = p.value(scattered);
	if (pdf_val > 0) {
		const float scattering_pdf = fmaxf(0, dot(hit_n, scattered) / M_PI);

		crec.origin = hit_p;
		crec.direction = scattered;
		crec.color = albedo*scattering_pdf / pdf_val;
		crec.done = false;
	}
	else {
		crec.color = make_float3(0, 0, 0);
		crec.done = true;
	}
	delete scatter_pdf;
}
At this point, anyone who knows how CUDA works would have spotted the culprit, but in my case I had no clue, especially that the visual profiler was not pointing to anything in particular. So I started commenting code out to see what was causing the problem, and when I removed the cosine_pdf logic the kernel time suddenly dropped to 0!
Turns out using new operator, or malloc() is quite expensive, especially if you do it for every thread and for every kernel call. I naively the memory was allocated locally, but it was done in global memory. I removed the allocation and changed the kernel logic to the following:
__global__ void simple_color(const ray* rays, const uint num_rays, const cu_hit* hits, clr_rec* clrs, const uint seed, const float3 albedo, const sun s) {

	const int ray_idx = blockDim.x * blockIdx.x + threadIdx.x;
	if (ray_idx >= num_rays) return;

	const ray& r = rays[ray_idx];
	const cu_hit hit(hits[ray_idx]);
	clr_rec& crec = clrs[ray_idx];

	if (hit.hit_face == NO_HIT) {
		// no intersection with spheres, return sky color
		if (s.pdf_value(r.origin, r.direction) > 0) {
			crec.color = s.clr;
			crec.done = true;
		}
		else {
			crec.color = make_float3(0);
			crec.done = true;
		}
		return;
	}

	const float3 hit_n = make_float3(
		-1 * (hit.hit_face == X)*signum(r.direction.x),
		-1 * (hit.hit_face == Y)*signum(r.direction.y),
		-1 * (hit.hit_face == Z)*signum(r.direction.z)
	);

	cosine_pdf scatter_pdf(hit_n);

	const float3 hit_p(r.point_at_parameter(hit.hit_t));
	sun_pdf plight(&s, hit_p);
	mixture_pdf p(&plight, &scatter_pdf);

	curandStatePhilox4_32_10_t lseed;
	curand_init(0, seed*blockDim.x + threadIdx.x, 0, &lseed);
	const float3 scattered(p.generate(&lseed));
	const float pdf_val = p.value(scattered);
	if (pdf_val > 0) {
		const float scattering_pdf = fmaxf(0, dot(hit_n, scattered) / M_PI);

		crec.origin = hit_p;
		crec.direction = scattered;
		crec.color = albedo*scattering_pdf / pdf_val;
		crec.done = false;
	}
	else {
		crec.color = make_float3(0, 0, 0);
		crec.done = true;
	}
}
Running the benchmark again, I was amazed by the results:
voxel size (512, 125, 512)
num_rays per iteration 250.0 thousand
num iterations 285 in 15 seconds
hit_scene took 12 seconds
  5.9 million rays/s
simple_color took 1 seconds
  71.3 million rays/s
Not bad for a few line changes. I then went back and made similar changes to the renderer, and the same image now takes 18s rendering 5M rays/s. As expected hit_scene is now the bottleneck.
As always, full source available here