Kernel Optimization
Guided Optimization
In the previous blog post, we’ve achieved a median 86.5M rays/s after moving the scattering logic to the gpu. As a result nvprof was showing that 50% of the rendering time was taken by scatterKernel. In this blog post we are going to use Nvidia’s Visual Profiler that comes with Cuda to analyse and optimize the kernels further.
Preparation
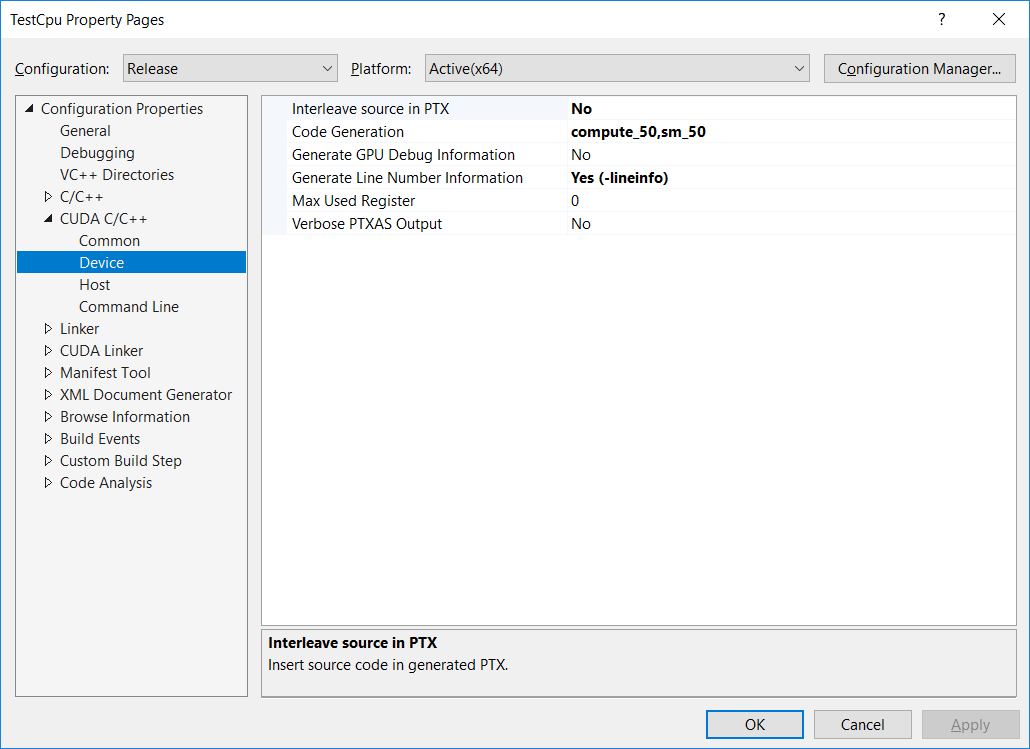
Before we start profiling our code, we make a slight change to the project settings to include kernels line information in the ptx files. This will allow the profiler to pinpoint some bottleneck issues directly in the source code.
To do this, right click on your Cuda project in the solution explorer and choose Properties, then click on CUDA C/C++ on the left, then Device and finally set Generate Line Number Information to Yes (-lineinfo) as shown by the following screenshot:
Profiler’s Timeline
Once we run the visual profiler, the first thing we see is the timeline view of our application:
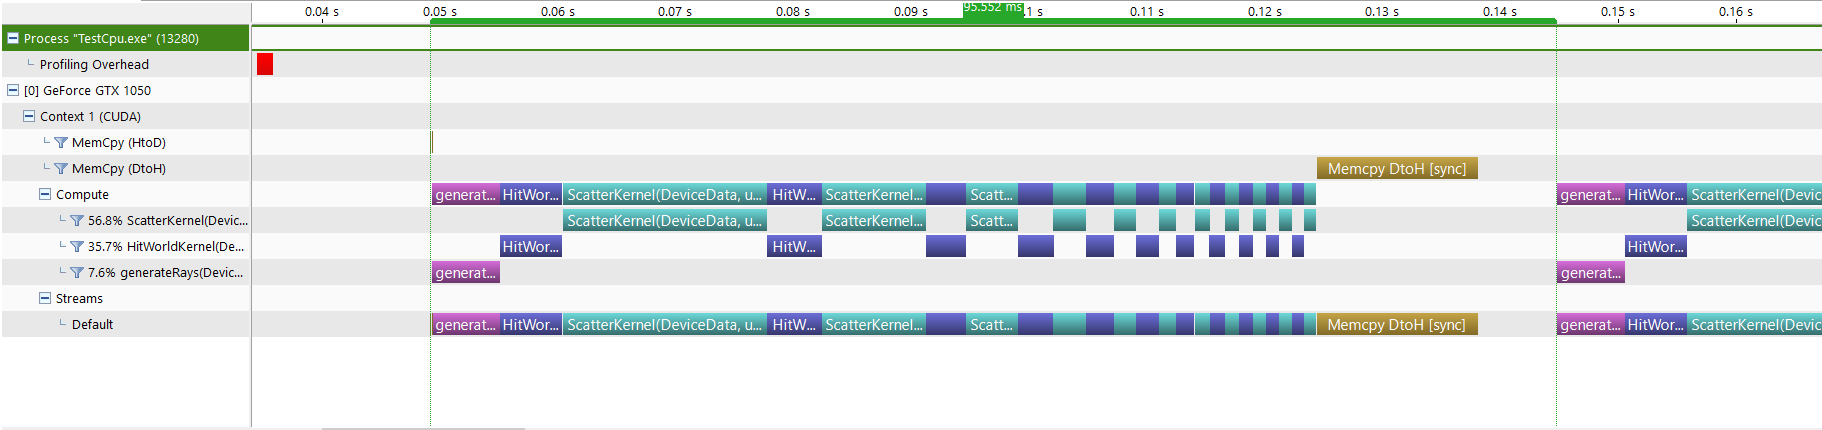
This is already useful as we get to visually see how long each device operation takes. Few things we notice already:
- Scatter kernel for depth 0 is the longest operation per frame ~17ms, this confirms what we already knew from nvprof
- HitWorld and Scatter kernels take less time for the subsequent depth iterations, which makes sense as less rays remain active every time rays bounce
- copying the results back to cpu at the end of each frame is nearly as expensive as the Scatter kernel ~13ms
- we can see a 7ms gap between successive frames, which is the time spent on cpu to process the colors at the end of each frame
Guided Analysis
Visual Profiler offers a guided analysis where it walks you through important analysis stages, exposing more detailed information at each stage and even pinpointing performance issues. We’ll use it in this post and see how much performance improvement we can get by following its suggestions.
First stage is Examine GPU Usage. For complex applications where multiple kernels are executed in parallel and where data copy can overlap with kernel execution, this stage is very useful, but for our application it’s less relevant, so we’ll just skip it.
We click on Examine Individual Kernels, and we get this list:
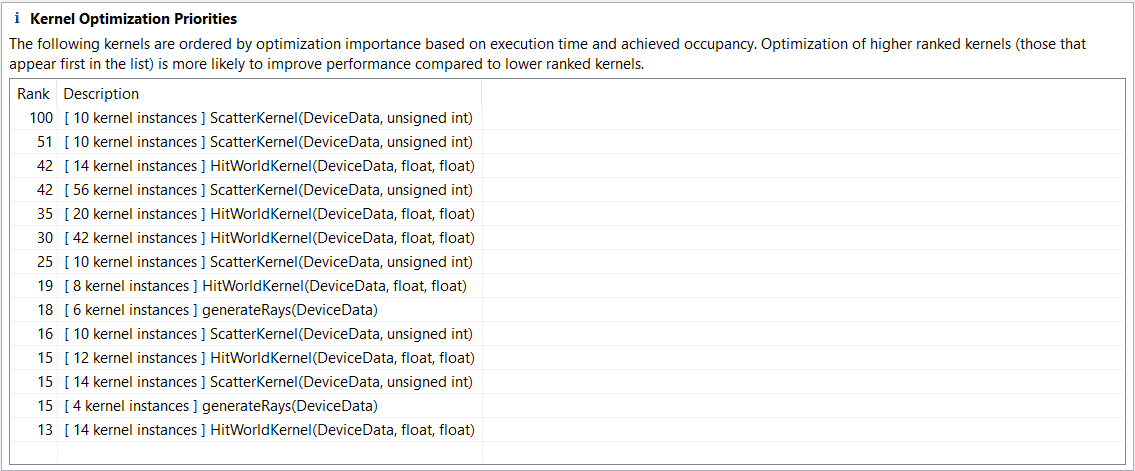
The profiler sorts all kernels by performance importance, so we can quickly see which kernel should be optimized first to get the highest impact on performance. Scatter kernel for depth 0 is the bottleneck so let’s get more information about it. After selecting the kernel, we click on the next step which is Perform Kernel Analysis, and we get the following:
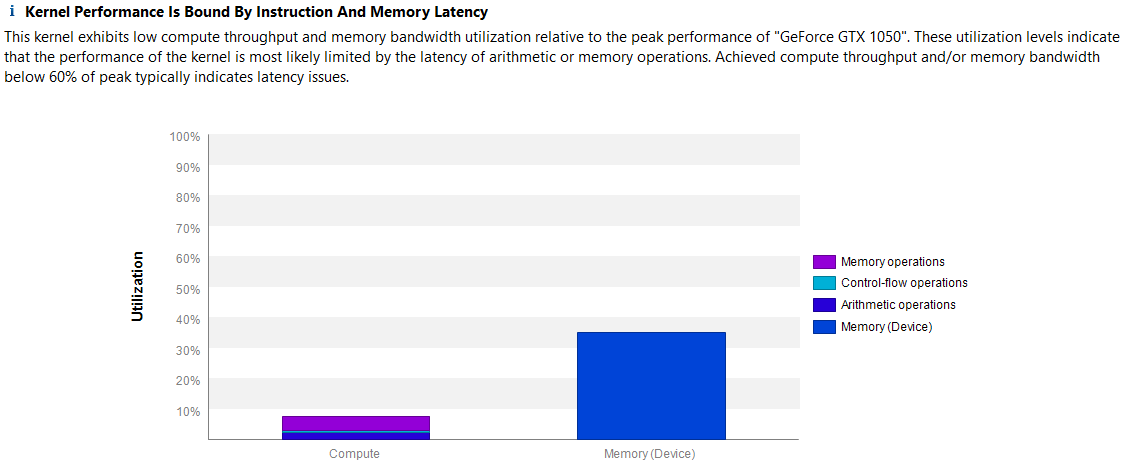
The analysis actually points that latency issues are most likely the cause of the low performance of the kernel. Latency issues indicate that our kernel is not fully utilizing the hardware as most warps are idle waiting on either an instruction or memory dependency to be done first. Here is a good Nvidia’s developer blog post That goes into more details about how to profile latency issues.
Following the guided analysis, we click on the next step Perform Latency Analysis. The profiler concludes that kernel occupancy is not limiting kernel performance. Occupancy being not an issue, we naturally click on the next analysis step Show Kernel Profile - PC Sampling, this samples additional metrics to help pinpoint what’s causing latency issues:
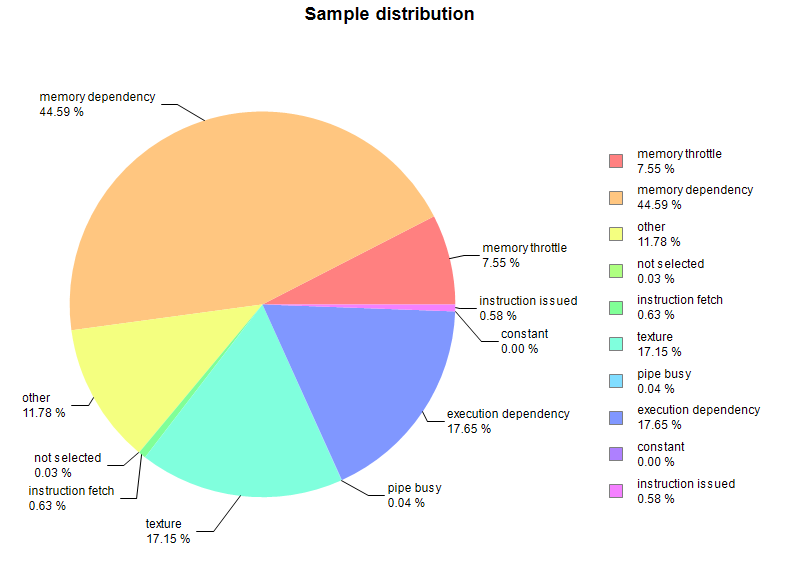
45% of the latency issues are related to memory dependency. CUDA profiler’s documentation gives a very good description on memory dependency and has multiple suggestions on how to improve the performance. In particular:
Try to improve memory coalescing and/or efficiency of bytes fetched (alignment, etc.). Look at the source level analysis ‘Global Memory Access Pattern’ and/or the metrics gld_efficiency and gst_efficiency.
Following the profiler’s suggestion we switch to Unguided Analysis, then we click on Global Memory Access Pattern:
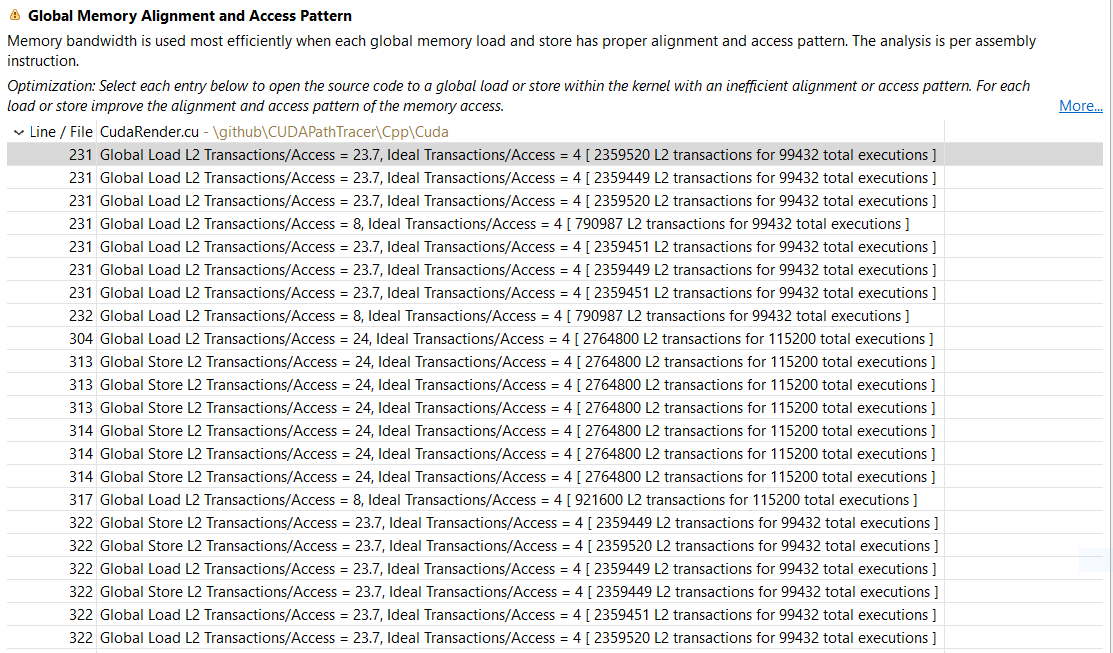
Each line points to a specific memory instruction and how many global accesses the instruction is currently doing vs how much it should if it was fully coalesced. We can see that most instructions are using 2x - 6x more accesses than they should. Clicking on any of those lines shows the line of code related to it (that’s why we enabled lineinfo generation at the beginning of this post).
CUDA best practices guide has a good explanation on how coalesced memory can help achieve higher performance, and how it’s critical to address first.
Profiler shows that most memory dependency issues for the Scatter kernel are related to:
- loading/storing rays, either when computing ray intersection, setting ray.done, or storing scattered ray
- loading hit t/id
- storing sample color/attenuation
- loading intersected sphere/material
Don’t use references when accessing global variables
Looking at the global memory access pattern for Scatter kernel, I realized that I was using references to global variables, this means that the kernel will always access the variable from global memory even if its not needed. So let’s just change that. This simple change improved median rendering performance to 94.2M rays/s
Coalescing rays and hits
One obvious way to optimize memory access when dealing with array of structs (AoS) is to use structures of arrays instead (SoA). The general idea is that instead of storing hits as an array of the following structs:
struct Hit {
  float t;
  int id;
};
Hit* hits;
We store the fields in separate arrays:
float* hits_t;
int* hits_id;
Here is the full set of changes that also changes how we store rays. Median rendering performance increased to 145M rays/s, which is incredible for just changing how we store data in memory.
Coalescing samples
Using the Visual Profiler, it’s still pointing to Scatter kernel as being the main bottleneck, and global memory access to the samples is now the main issue.
Samples are stored as an array of:
struct Sample {
  float3 color;
  float3 attenuation;
};
As a first step, let’s store color and attenuation in separate arrays. As soon as we do this I realized I only need to copy colors to the cpu after each iteration (actually not really, but more on that below). This change increased median rendering performance to 180.2M rays/s.
Let’s go one step further and split color and attenuation components into separate arrays, this should improve our rendering performance but instead it drops to a median 161.5M rays/s.
Using the visual profiler, and looking at the timeline before and after this last change:
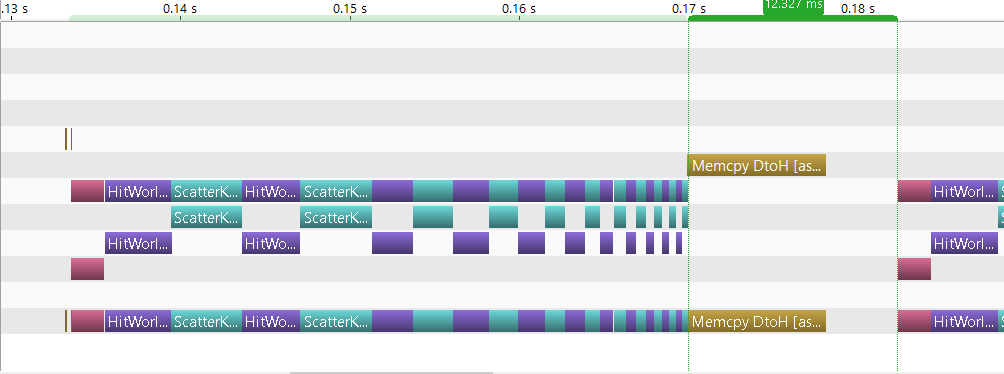
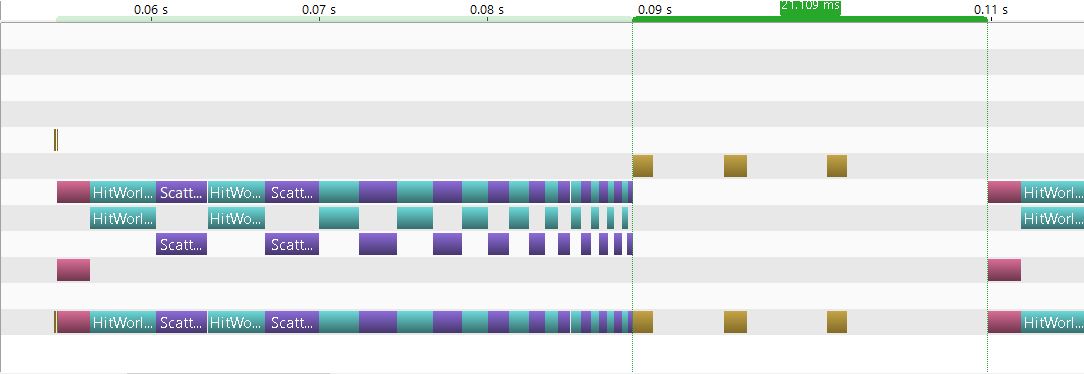
We can see that it’s now taking 21ms each frame to copy the colors back to cpu vs 12ms before. This is because we now need to copy 3 buffers from device to host and iterate over each one of them which takes longer.
Only copy the colors once
The only reason we need to copy the colors to the host after each frame is to cumulate their values so we can compute the final colors at the end of rendering. But we can just do it on the device itself and only copy the colors after we are done rendering all frames. Once we make this change, performance increases dramatically to a median of 238M rays/s
Don’t use references, seriously!
Turns out I was still using references to global variables in Scatter kernel. Fixing it increased the median performance to 263.7M rays/s.
Constant memory
Looking at the profiler, Scatter kernel is still the primary kernel that should be optimized, but apart from its excessive reads/writes to global memory, nothing really jumps out. For each thread, the kernel needs to read the ray, color and attenuation of the corresponding sample along with the intersected sphere and material. Because the scene data is constant and is small enough, we can store it into constant memory. Cuda offers 64KB of constant memory that is read only and cached, which means the gpu only has to read the data once from global memory. The change is simple enough, we just need to mark the spheres array as follow:
__device__ __constant__ cSphere d_spheres[kSphereCount];
Then we can copy the spheres to it once:
cudaMemcpyToSymbol(d_spheres, spheres, kSphereCount * sizeof(cSphere));
Here is a link to the commit where we store the spheres in constant memory, and the commit where we store the materials in constant memory.
After making both changes the median performance of the renderer is around 348M rays/s!!!
Conclusion
In this post we’ve used the Visual profiler that comes with Cuda to identify performance bottlenecks, and we’ve followed the profiler’s suggestions to fix those bottlenecks.
Our render’s performance increased gradually from 86.5M rays/s to an incredible 348M rays/s.
All our improvements are around global memory access, which shows just how slow those accesses are and why we need to write the kernels to optimize how we access the data from global memory, either by using the proper structures to minimizes the accesses or when possible to use different kind of device memory. Running the profiler once more, Scatter kernel is still at the top of the list of kernels to optimize and its performance is dominated by memory accesses:
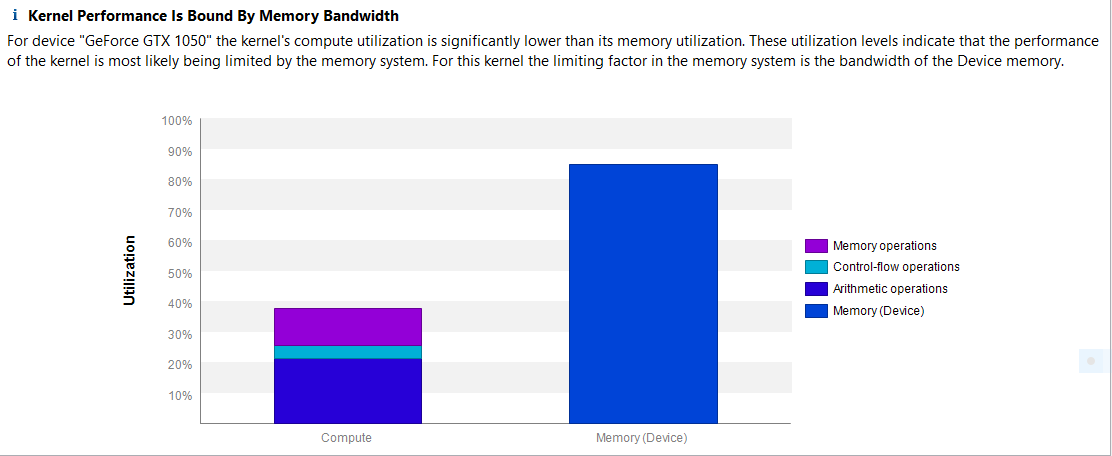
Even though we are using constant memory and the rays are coalesced, it’s still a lot of data that the kernel needs to read and write each iteration’s of each frame.