Scatter Kernel
Move more rendering logic to the gpu
In our previous post we had the following cpu profile:
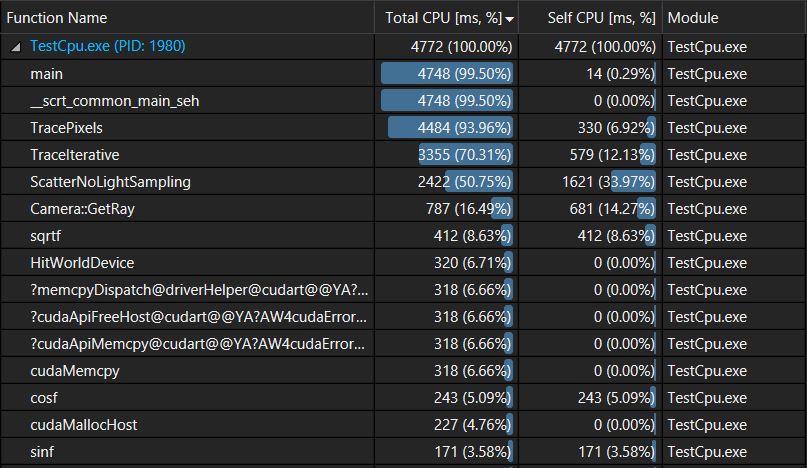
As we can see, generating the scattered rays is what takes the most of our rendering time. So the next logical step is to move it to the gpu. Once we do that we should move ray generation as well to remove any need to copy data from host to device. After that we won’t really need to compact the non active rays, at least not for now. So we’ll start our work from the version of the code prior to ray compaction.
Ray scattering
As we already described in one of our previous posts here is the pseudo-code for the rendering logic where ray world intersection is handled by the gpu:
for each frame:
  rays = generate all camera rays (screenWidth x screenHeight x samplesPerPixel)
  reset all samples to { color(0, 0, 0), attenuation(1, 1, 1) }
  for depth = [0, kMaxDepth]:
    HitWorld(rays)
    for each ray with index i in rays:
      if hits[i].id >= 0:
        samples[i].color += intersected sphere's material emission
        if depth < kMaxDepth and Scatter(ray, attn, scattered):
          samples[i].attenuation x= attn
          rays[i] = scattered
        else:
          rays[i].done = true
        end
      else:
        samples[i].color += computed sky color
        rays[i].done = true
      end
    end
  end
end
Rewriting the scatter logic to work on device isn’t that hard, most of the code will remain the same. But scatter() relies on a simple xorshift pseudo-random number generator. Xorshift relies on a single state variable that’s updated every time we generate a random number. For the cpu code it’s not an issue as we handle all rays sequentially so they can all share the same state, but for the gpu we need a separate state per ray.
The general idea is that we want to generate a random seed from the frame number, and the ray’s Id. I used the following formula which seems to give satisfying results:
uint state = (wang_hash(rayID) + frameID * large_prime_1) * large_prime_2
It’s based on the following course.
Wang hash is motivated by the following blog post
Counting number of active rays
Once we intersect all rays with the scene, we compute how many of these rays are still active, and we use it to track the total number of rays handled by the render. This is mainly used to compute the final performance measure (rays/s).
Once we move the scatter logic to the gpu we will no longer need to copy the hits back to the cpu at the end of each frame, so we’ll have to count the rays in the kernel code. This is not as straightforward as it seems and we’ll leave it for a future post in the series. For now we are going to assume that the number of rays is the same for both cpu and gpu implementations, as we are using the same logic and pseudo random generators.
Writing the scatter kernel
Once we figured out how to compute xorshift state and decided not to count the active rays for now, moving the scatter logic to the gpu is straightforward. Here is a link to the commit. The only reason it’s so big is that we are still keeping the cpu implementation for now so we need to duplicate most of the used functions to use Cuda’s float3 and to mark them as device functions.
Running the renderer we are now getting a performance of 39.3M rays/s. The renderer is 3x faster than the previous implementation, and 5x faster than the original single threaded cpu implementation.
Running nvprof on the renderer we get the following output:
GPU activities:   45.00%  385.73ms       110  3.5067ms  1.0550ms  17.244ms  ScatterKernel(DeviceData, unsigned int)
                   27.66%  237.08ms       110  2.1552ms  1.1633ms  5.1389ms  HitWorldKernel(DeviceData, float, float)
                   18.86%  161.66ms        10  16.166ms  15.089ms  17.079ms  [CUDA memcpy DtoH]
                    8.49%  72.773ms        12  6.0644ms     608ns  8.0377ms  [CUDA memcpy HtoD]
      API calls:   78.64%  860.78ms        22  39.127ms  71.841us  91.112ms  cudaMemcpy
                   14.03%  153.61ms         2  76.803ms  8.1760ms  145.43ms  cudaMallocHost
                    4.87%  53.304ms         1  53.304ms  53.304ms  53.304ms  cuDevicePrimaryCtxRelease
                    1.15%  12.587ms         2  6.2935ms  3.3327ms  9.2543ms  cudaFreeHost
                    0.92%  10.023ms         5  2.0045ms  13.493us  3.8852ms  cudaMalloc
                    0.14%  1.5626ms         4  390.66us  49.595us  623.59us  cudaFree
                    0.12%  1.3325ms       220  6.0560us  3.6460us  35.373us  cudaLaunchKernel
                    0.08%  917.88us        40  22.947us     364ns  487.20us  cuDeviceGetAttribute
                    0.04%  483.19us         1  483.19us  483.19us  483.19us  cuModuleUnload
                    0.00%  34.644us         1  34.644us  34.644us  34.644us  cuDeviceGetName
                    0.00%  9.8470us         1  9.8470us  9.8470us  9.8470us  cuDeviceTotalMem
                    0.00%  8.3880us         1  8.3880us  8.3880us  8.3880us  cuDeviceGetPCIBusId
                    0.00%  2.5520us         3     850ns     364ns  1.8230us  cuDeviceGetCount
                    0.00%  1.0940us         2     547ns     365ns     729ns  cuDeviceGet
We can see that most of the time is now taken by the kernels, as we are no longer copying huge amounts of data between the host and device. Cpu profiler shows the following:
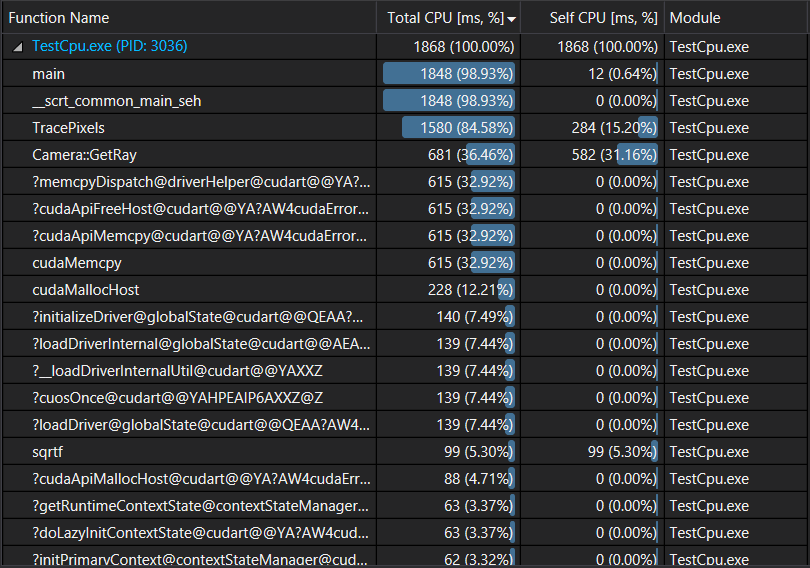
Looks like the slowest part is now the camera ray generation as it takes 36% of the rendering time. There is no reason not to move it to the gpu as well as it will also remove the need to copy the rays to gpu at the start of each frame.
Generate rays on gpu
Moving ray generation to the gpu is not complicated. We add a new kernel that will generate the rays using a xorshift random state initialized as we described before. Most of the changes involve refactoring the renderer code to handle both cpu and gpu rendering. Here is a link to the commit.
Rendering performance went up to 86.5M rays/s. The renderer is nearly 11x faster than the original single threaded cpu implementation.
A look at the cpu profile shows that 90% of the time is now spent in the kernels:
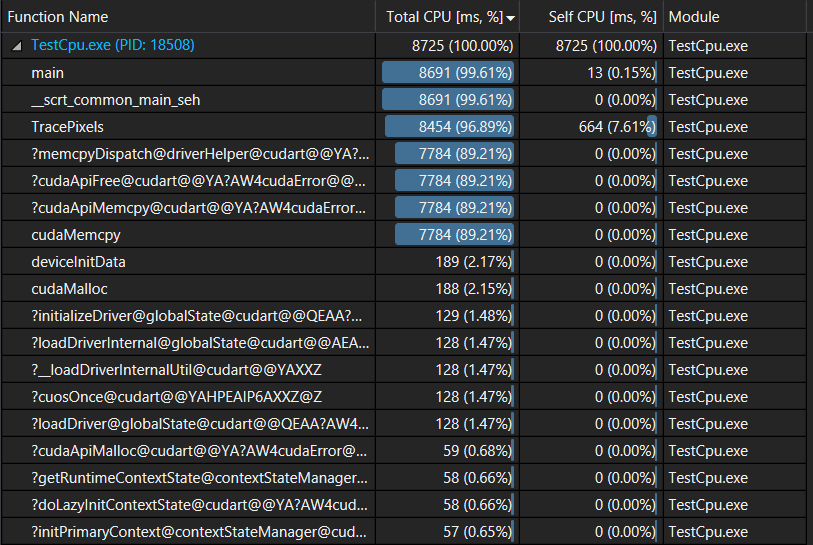
and nvprof show that Scatter kernel takes nearly 50% of the device time:
            Type  Time(%)      Time     Calls       Avg       Min       Max  Name
 GPU activities:   46.36%  3.75411s      1100  3.4128ms  1.0449ms  17.251ms  ScatterKernel(DeviceData, unsigned int)
                   28.36%  2.29702s      1100  2.0882ms  1.1570ms  5.1423ms  HitWorldKernel(DeviceData, float, float)
                   19.70%  1.59537s       100  15.954ms  14.254ms  29.381ms  [CUDA memcpy DtoH]
                    5.58%  451.68ms       100  4.5168ms  4.4661ms  5.7258ms  generateRays(DeviceData)
                    0.00%  2.3360us         3     778ns     576ns  1.0560us  [CUDA memcpy HtoD]
      API calls:   97.67%  8.11370s       103  78.774ms  75.122us  95.287ms  cudaMemcpy
                    1.58%  131.13ms         6  21.855ms  8.7520us  120.89ms  cudaMalloc
                    0.52%  42.936ms         1  42.936ms  42.936ms  42.936ms  cuDevicePrimaryCtxRelease
                    0.20%  16.210ms      2300  7.0470us  3.6460us  98.826us  cudaLaunchKernel
                    0.02%  1.5685ms         5  313.69us  32.091us  642.92us  cudaFree
                    0.01%  981.70us        51  19.248us     364ns  466.42us  cuDeviceGetAttribute
                    0.01%  435.42us         1  435.42us  435.42us  435.42us  cuModuleUnload
                    0.00%  35.373us         1  35.373us  35.373us  35.373us  cuDeviceGetName
                    0.00%  28.809us         1  28.809us  28.809us  28.809us  cuDeviceTotalMem
                    0.00%  8.3880us         1  8.3880us  8.3880us  8.3880us  cuDeviceGetPCIBusId
                    0.00%  2.5530us         3     851ns     365ns  1.8230us  cuDeviceGetCount
                    0.00%  1.0930us         2     546ns     364ns     729ns  cuDeviceGet
Conclusion
It took us some time but we are finally at a point where most of the rendering time is spent on the device, which means in the next blog posts we’ll start exploring how we can optimize the kernels.